Public transport in Turin: surface fleet analysis
Since 2024, I have been collecting the real time positions of the buses in Turin, by accessing the GTFS Realtime endpoint provided by GTT. By now, I have collected data for almost 2 years, and have become very fascinated about diving inside and get useful insights. Each data point comprises (after processing) a GPS location (latitude, longitude, bearing), which route the vehicle is serving, the vehicle “label” (which for GTT is the “matricola”, or registration number by the company) and trip information (the trip id, service date and start time for the trip).
Of all data, the trip ids give the most information they are tied to the GTFS (static) data: by searching one trip id in that dataset, it becomes possible to know which stops it serves and in which direction the vehicle is going. From analysing the GTFS data for GTT, it is evident that trips made at different days use different trip ids, so each one corresponds to an actual trip during the day. Combining this with the vehicle registration number (for which I will the acronym RN), it is possible to calculate some statistics which are downright impossible without the realtime data, for example the total distance driven by each vehicle (per day/month), or which vehicles do more trips, or are most used during the weekends. In the following, I will focus on the vehicles rather than other interesting quantities like the average speed of a line (see my other post for that).
Distinguishing the vehicles
It’s common for public transport companies to order vehicles in batches, for example when a new line opens. A few months ago I found the TPL Italia website, which has a list (in Italian) of vehicles used by different public trasport companies throughout Italy divided by batches, along with the registration numbers. Cross-referencing the data on the website and the registration numbers I collected, I divided the vehicles in 16 classes (or “series”, from the Italian word), 12 for buses and 4 for trams.
For the buses I used these classes:
- Iveco Cityclass, oldest buses used, from about 20 years ago (from 2005 to 2008);
- Irisbus Citelis, in two different lengths, 12m and 18m. These were acquired from 2009 to 2014;
- Mercedes-Benz Conecto, bought from 2019 to 2020, in both lengths as before, 12m and 18m;
- BYD K9, electric buses, there was a first series in 2019 of few vehicles then another big order arrived between 2021 and 2024;
- BYD K7, a predecessor series of the BYD K9 (2017), of just 8 vehicles (according to TPL Italia website);
- Menarini Citymood, two different batches in 2022 and 2024;
- UrbanWay, 18 m long buses (2023-2024), which is now absent from the TPL Italia website (?);
- IrisBus BlueBus, electric and small (I will then call them “MiniBus”), which have been bought to serve the Star 1 & 2 line in 2025
- Iveco E-Way series, electric buses, intially both in 2024. There now an 18 m long version of this also in use, which counts as a different series (RNs 96xx, while the 12m E-Way are from 94xx to 95xx). Recently, a new series of 18m long is arriving, called “BRT” by GTT (simply because they are able to charge at specially-equipped bus stops).
There are other series of buses in the website (like the ones that were previously used in the Star lines), but either were absent from the dataset of positions or I was unable to match the registration numbers.
There are 4 different series for trams in service in Turin from 2020, distinguished by the registration number series:
- The so-called “2800” are the old orange trams, and they have been in service for about 40 years. They are the only ones that need to be accessed with stairs. In the following, I will call them “Arancio” based on their color, orange.
- The “5000” trams are, in contrast, painted grey and have been the first in Turin equipped with floor level access. They have been around since 1990.
- The “6000” are the largest trams to ride in Turin, they were ordered in 2000 for the line 4, and are painted blue. They are bulky and long (34 m, while the 5000 are 22 m long). Some are bidirectional, so that they can be driven in both directions, but most of them are not.
- The “8000” series are the latest ones, first starting service in 2024. They are painted blue in the front, end and top, and yellow on the sides. In the following I will also call them “Hitachi” because of the company that makes them (Hitachi Rail).
Other classes of trams have been in service in Turin, but not in these years, If you want more information on trams currently in use, you can find it here.
General statistics
Now that I have given you an overview of the vehicles used by GTT, we can move to the analysis part. In this section, I will show some of the statistics I have produced so far.
Let us look first at the number of trip ids collected, which, as I said above, translates to the number of actual voyages done by the vehicles each day.
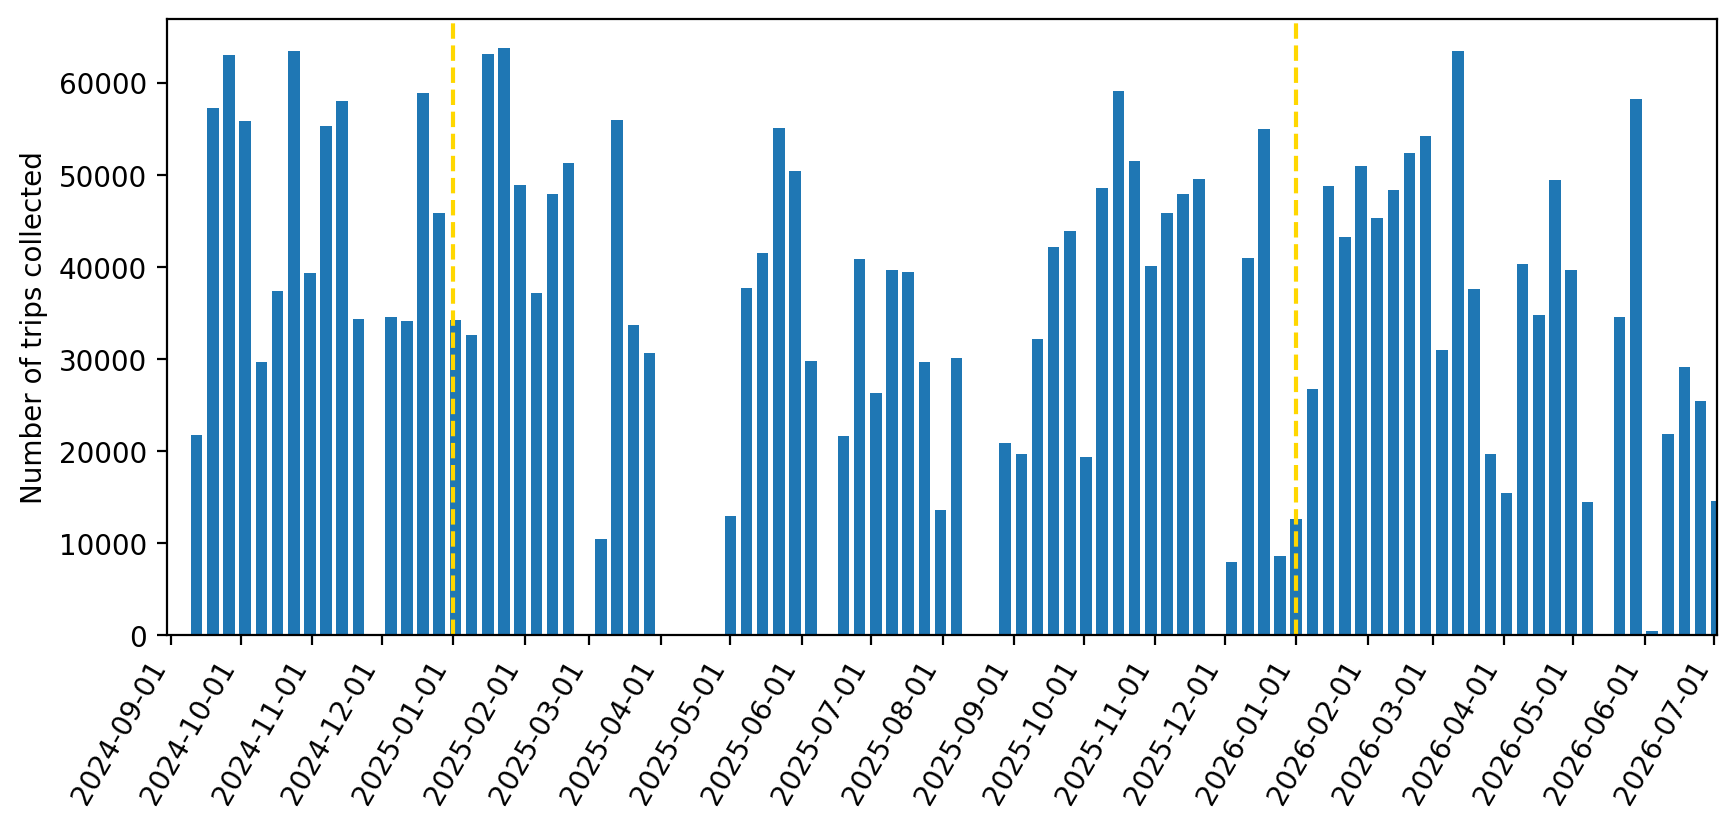
As you can see, there were some weeks in which no data was recorded, because of either a downtime of the server, or a mistake on my part with the parsing code. This is particularly evident in April and August 2025. I must also point out that after May 2026, the position updates also started presenting missing data regarding the trip id, the start date and service day. I have run some statistic, and the fraction of invalid positions (including the case with null GPS location) rose from about 2% in 2025 to 15% in May 2026 and 39% in June 2026.
Electric buses
If you took notice in the previous section, many of the series of buses recently added by GTT are electric ones. It is interesting then to look at the fraction of buses in service each month that are electric (associating to each vehicle registration number if it is electric or not):
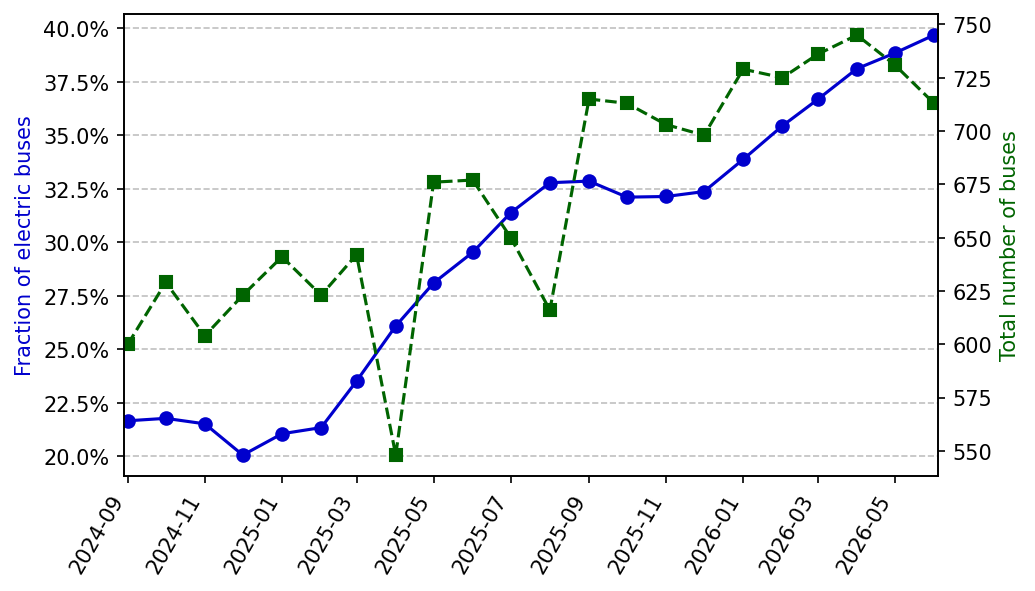
From this graph, you can see that fraction of electric vehicles in active service in the last two years approximately doubled, from 20% to almost 40%! From this plot, it is also quite easy to see the missing data from April and August 2025, as the number of buses recorded is plummeting in these months.
Fleet composition
To understand how the fraction of electric buses increased from 2025, let us check how many different vehicles are found for each series for each month. This is shown as a heatmap:
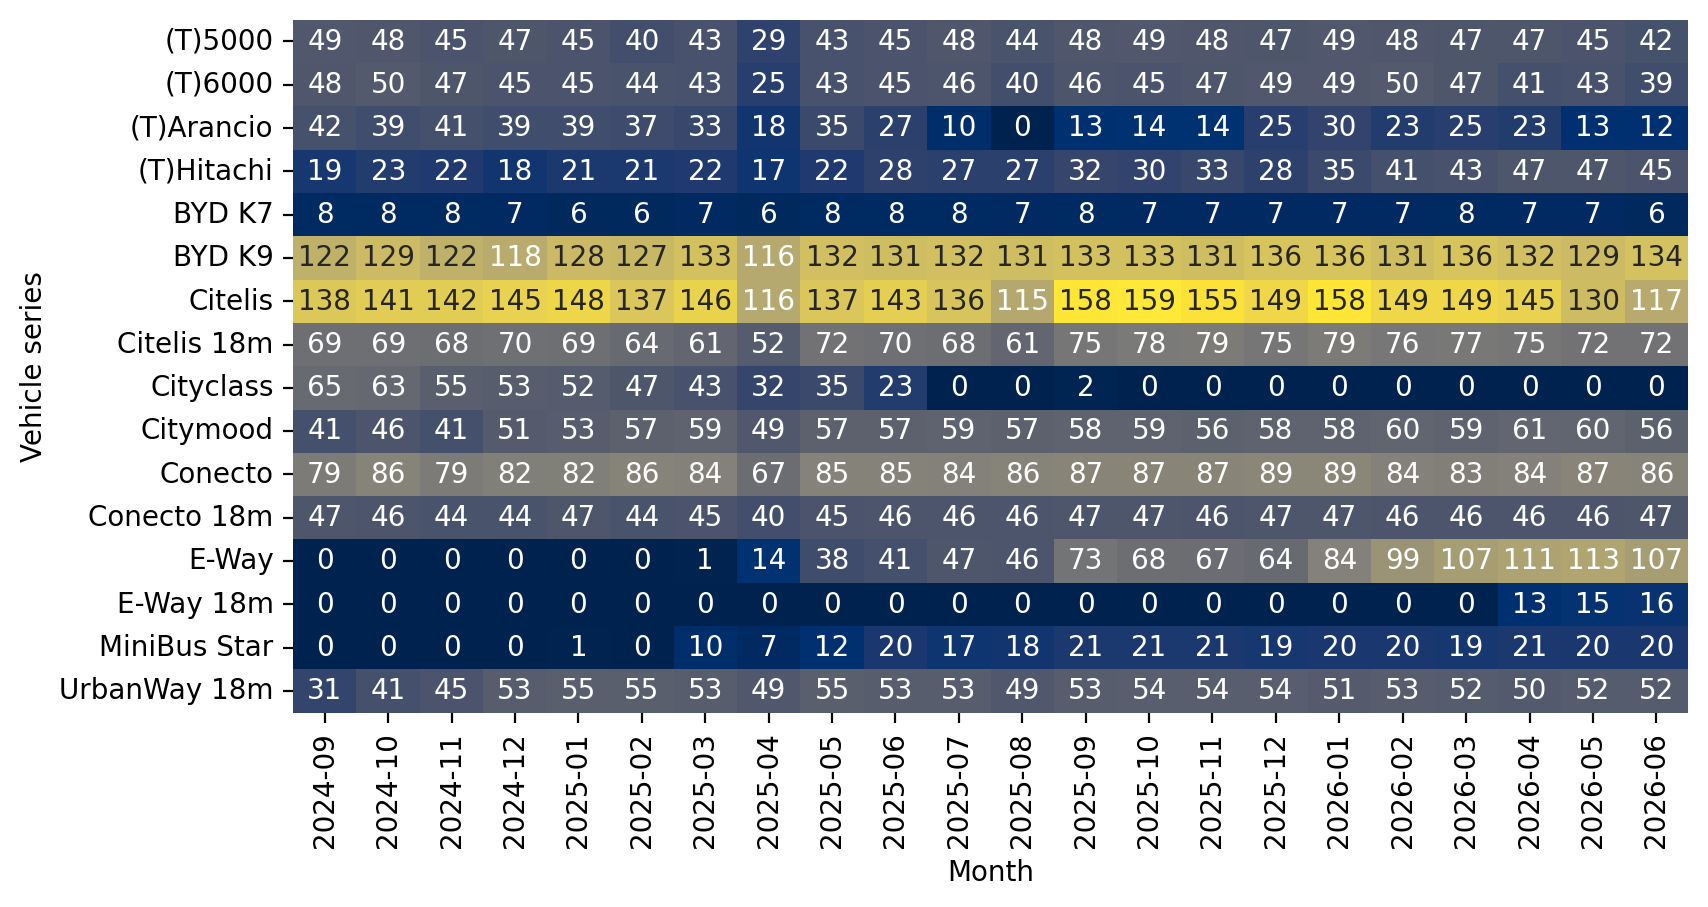
The most numerous series are BYD K9 and Citelis, followed by the Mercedes Conecto and Citelis 18m. Over the months, the E-Way buses began service and grew in number to about 110. Moreover, the Cityclass buses (which are the oldest ones) stopped service from the summer of 2025. It was about time, as they were becoming too old!
Regarding trams, infrastructure work started in the spring of 2026 which limited the lines on which they could be employed. As a consequence, the number of 2800 Trams (called “Arancio” in the plot) have almost halved in May and June 2026. The number of Hitachi trams in service also grew from about 20 to 47, equalling the other classes in service! Over the years, Turin is supposed to receive 70 Hitachi trams in total, and (hopefully) dismiss the old orange ones, which have been a symbol of the city for so long.
Conclusion
In this post, I showed some simple statistics I have been doing in my free time about the vehicles used in Turin. It was good to see the update of the fleet over the last few years, with the Citymood buses removed from service last year. Now I’m waiting for the Citelis ones to do the same, as the new electric buses arrive in the city.
There is a lot of potential to investigate other aspects of the quality of public transport in Turin. However, I would like to point out that a lot depends on the quantity and quality of the data which is made available for analysis. Often times, in the past year, the GTFS realtime service stopped sending data for days, but since May 2026 there has been a worrying change in the data itself: before, trip data was always associated to each vehicle position shown, now the trip data have started to become missing, with almost all of the positions showing no trip indication in some days. At first, I was thinking I am not sure if these incomplete data points should be included, as they were representing buses not in active service (moved between depots maybe). Now I am conviced there are some problems in the data processing pipeline in GTT (or whichever agency does it instead of them).
You can have a peek at the data I have collected using a dashboard I made that shows the number of trips and vehicles (divided by vehicle class) for each line. You can find it at the website: gttveicoli.streamlit.app. If you get some interesting insights from the data, let me know!
Enjoy Reading This Article?
Here are some more articles you might like to read next: